HeapHero: Memory is not cheap, and Application Performance Improvement Parameters – Memory Tool – HeapHero
Most of the developers facing some issues while development is completed
- API Loading
- Threads block
- GC Perform
- Duplicate String or Objects
- Inefficient Collections
- Coding Standard
- CPU, Memory, Network, Storage
- More Object Created
One of the widely wasted resources in the world today is Memory. Due to inefficient programming, a surprising amount
of memory is wasted.
We see this pattern repeated in several enterprise applications.
We analyzed the famous spring boot pet clinic application to see how much memory it is wasting.
This application has been designed by the community to show how the spring application framework can be used to
build simple but powerful database-oriented applications.
API Testing using JMeter
We used Apache JMeter, a
popular open-source load testing tool
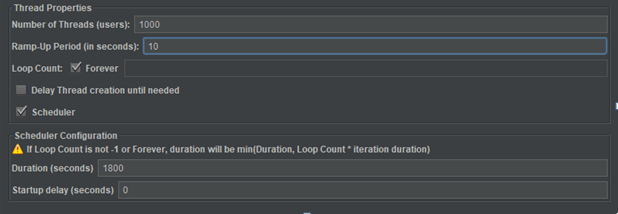
We executed the load test for 30 minutes with the below settings:
- Number of Threads (Users) – 1000 (Number of users connects to the target)
- Ramp-Up Period (in seconds) – 10. The time frame for all requests to start. As per our
configuration at every 0.01 second, 1 new thread will start i.e 100 threads/second. - Loop Count – Forever. These 1000 threads perform test iterations back-to-back.
- Duration (seconds) –1800. After ramp-up 1000 threads run continuously for 1800 seconds.
- Jmeter settings:
We were exercising the following scenarios in our load test:
- Add a new pet owner to the system.
- View information pertaining to a pet owner.
- Add a new pet to a system.
- View information pertaining to a pet.
- Add information pertaining to a visit to a pet’s visitation history.
- Update the information pertaining to a pet.
- Update the information pertaining to a pet owner.
- View owner information by searching his name.
- View information of all owners.
Measure memory wastage
The industry has hundreds of tools to show the amount of memory used. But seldom we come
across tools that can measure the amount of memory wasted due to inefficient
programming. HeapHero is a
simple tool that analyzes your heap dumps and tells how much memory is wasted due to
inefficient programming.
We captured the heap dump from the Spring Boot Pet Clinic application when the test was running. (there
are 7 different options to capture heap dump from Java/Android
applications. You can choose the option that is convenient to you).
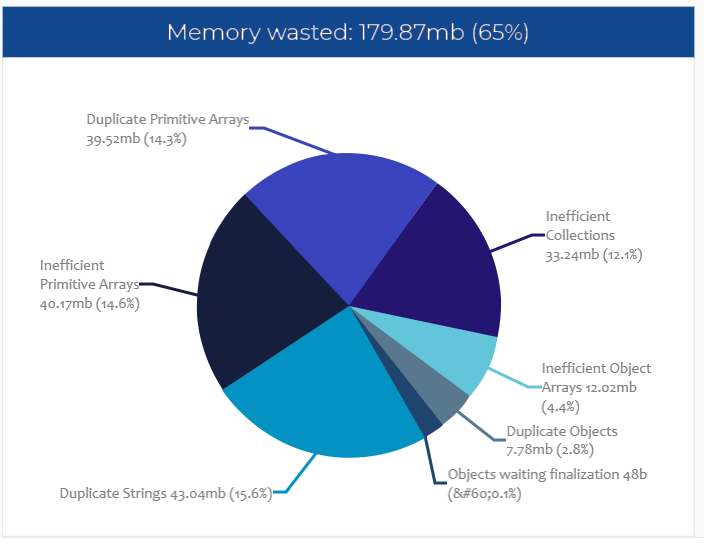
We uploaded the captured heap dump into the HeapHero tool. Tool generated this beautiful report showing that 65% of memory is wasted
due to inefficient programming. Yes, this is a simple vanilla application, which is supposed to have all best
practices implemented in it, that too on a highly celebrated framework is wasting 65% of memory.
Chart generated by HeapHero, showing 65% of memory is wasted by Spring Boot pet clinic application
Analyzing Memory wastage
From the report you can notice the following:
- 15.6% of memory is wasted due to duplicate strings
- 14.6% of memory is wasted due to inefficient primitive arrays
- 14.3% of memory is wasted due to duplicate primitive arrays
- 12.1% of memory is wasted due to inefficient collections
Duplicate Strings
Top reason for memory wastage in this Spring boot application (and in most enterprise
application) is: duplication of strings. The report shows how much memory is wasted due to duplicate of strings,
what strings are they, who is creating them and how to optimize it.
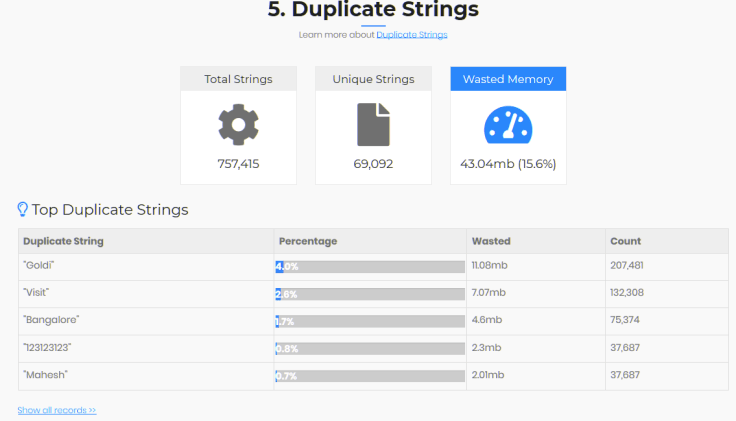
You can notice that 15.6% of memory is wasted due to duplicate strings. Please note
- ‘Goldi’ string is has been created 207,481 times.
- ‘Visit’ string has been created 132,308 times. ‘Visit’ was the description we mentioned in the test script.
- ‘Bangalore’ string has been created 75,374 times. ‘Banglore’ is the name of the city we specified in the
test script. - ‘123123123’ has been created 37,687 times.
- ‘Mahesh’ string has been created 37,687 times.
Apparently ‘Goldi’ is the name of the pet that was entered on the screen through the test script. ‘Visit’ was the
description entered on the screen through the test script. Similarly, are the values. But the question why so
many thousands of times these same string objects are created.
We all know that strings are immutable (i.e. once they are created, they can’t be modified). Given that why these
many thousands of duplicate strings are created?
HeapHero tool also reports the code path where these duplicate strings are created.
Codepath from where duplicate strings are originating

Here are the high-level recommendations to fix duplicate strings in your application.
You can employ the strategies are applicable to your application.
Inefficient Collections
Another primary reason for memory wastage in the spring boot pet clinic application is: inefficient collections
implementation. Below is the excerpt from the HeapHero report:
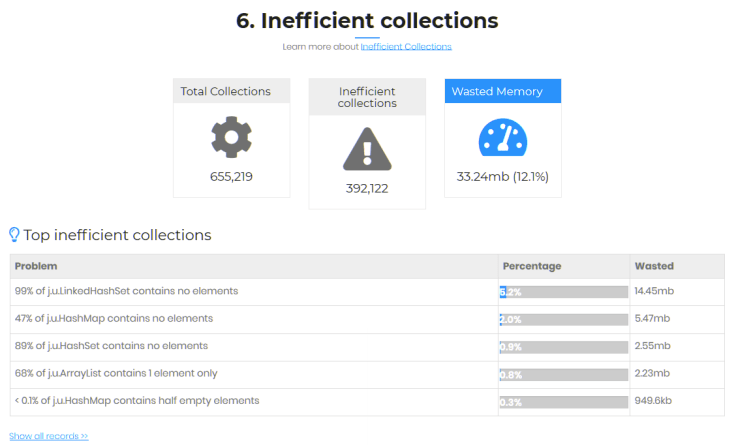
You can notice that 99% of LinkedHashSet in the memory doesn’t have any elements in them. If there are no
elements, why even create LinkedHashSet? When you create a new LinkedHashSet object, space for 16 elements are
reserved in memory. All the space reserved for those 16 elements are wasted now. If you do lazy initialization
of the LinedHashset then this problem wouldn’t arise.
Bad Practice:
private LinkedHashSet<String, String> myHashSet = new LinkedHashSet();

        public void addData(String key, String value) {

              myHashSet.put(key, value);
        }
Best Practice:
private LinkedHashSet<String, String> myHashSet;

        public void addData(String key, String value) {

              if (myHashSet == null) {

                   myHashSet = new LinkedHashSet();
              }

              myHashSet.put(key, value);
        }
Similarly, another observation is: 68% of ArrayList contains only 1 element in them. When you create an ArrayList
object, space for 10 elements are reserved in memory. It means in 88% of ArrayList 9 elements space is wasted.
If you can initialize ArrayList with capacity this problem can be avoided.
Bad Practice: Initializing Collections with default.
new ArrayList();
Best Practice: Initialize Collections with capacity
new ArrayList(1);
Memory is not cheap
One can counter-argue that memory is so cheap, so why do I need to worry about it? Fair question. But my friends’
memory is not cheap in the cloud computing era. There are 4 primary computing resources:
- CPU
- Memory
- Network
- Storage
Your application might be running on tens, thousands of application servers running on AWS EC2 instances. In the
above mentioned 4 computing resources, which resource gets saturated in an EC2 instance? I request you to pause
for a moment here, before reading further. Give a thought to figure out which resource gets saturated first.
For most applications, it is *memory*. CPU is always at 30 – 60%. There is always an abundance of storage. It’s
hard to saturate network (unless your application is streaming a lot of video content). Thus, for most
applications, it’s the memory that is getting saturated first. Even though CPU, storage, network is
underutilized, just because memory is getting saturated, you end up provisioning more and more EC2 instances.
This will increase your computing cost by several folds.
On the other hand, without exception, modern applications wastes anywhere from 30 – 90% of memory due to
inefficient programming practices. Even above Spring boot pet clinic without much business logic is wasting 65%
of memory. Real enterprise applications will be wasting in similar magnitude or even much more. Thus if you can
write memory-efficient code, it will bring down your computing cost. As memory is the first resource to get
saturated, if you can reduce memory consumption, you would be able to run your application on a smaller number
of server instances. You might be able to reduce 30 – 40% of servers. It means your management can reduce 30 –
40% of the data center (or cloud hosting provider) cost, plus maintenance and support cost. It can account for
several millions/billions of dollars in cost savings.
Conclusion
Besides reducing computing cost, your customer experience will also become a lot better when memory-efficient
code is written.
If you can reduce the number of objects that are created to service new incoming requests, your response time
will get a lot better.
Since less objects are created, less CPU cycles will be spent in creating and garbage collecting them. Reduction
in response time will give a better customer experience.


